Dashboard Overview
The dashboard is the screen you land on when you sign in, and the one you come back to between tasks. It's a single page that answers "what needs attention right now?" without your having to open each queue, reading room, and worklist by hand. It pulls live counts and lists from across Aeon and lays them out so you can see your workload and jump straight to whatever you want to work on next.
Most staff use the dashboard as a launch pad. You glance at it, spot the queue with requests waiting (or the reading room with three appointments still to confirm), click through, do the work, and come back. You don't process requests on the dashboard — clicking an item takes you to where you process it — but everything you need to reach is one click away.
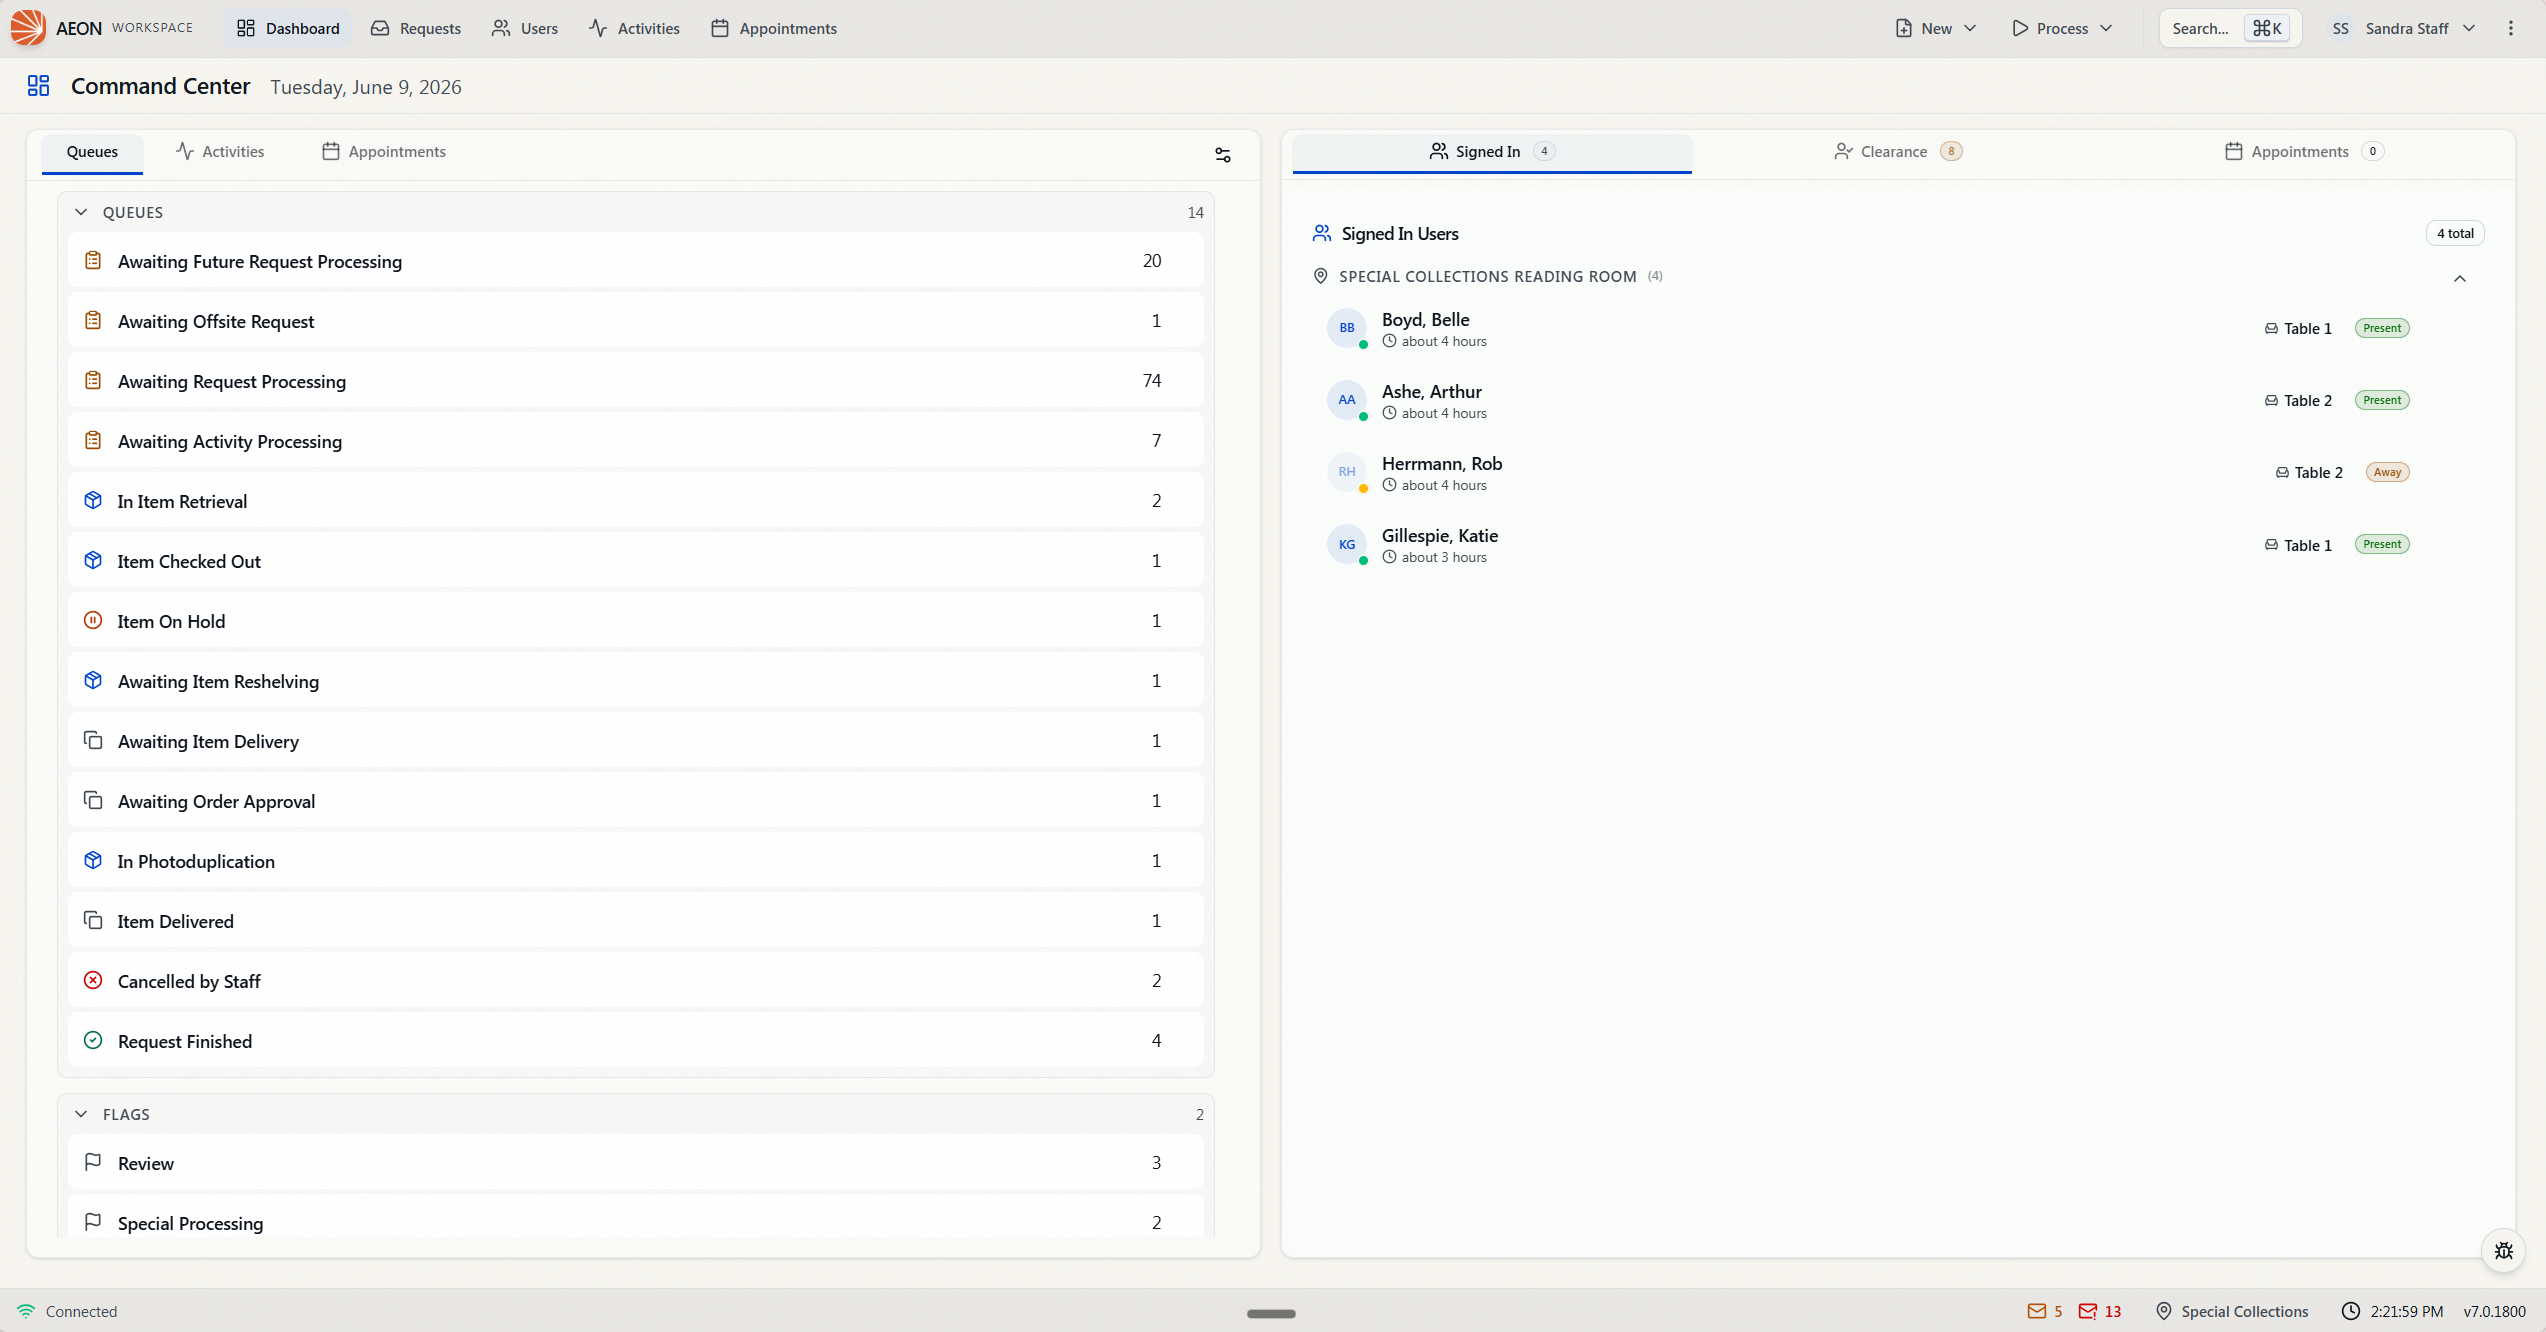
- At the start of a shift — see a snapshot of what's going on in the reading room: which queues have work, who's signed in, who's waiting to be cleared.
- Between tasks — return to the dashboard to pick up the next thing instead of hunting through the sidebar.
- Front desk — keep the dashboard open to watch the Signed In list and confirm appointments as researchers arrive.
Getting to the dashboard
The dashboard lives at /dashboard and is the default screen after login. You can return to it any time from the main navigation, or by opening the command palette (Cmd+K / Ctrl+K) and choosing the Dashboard navigation entry.
The header shows the dashboard's title — which appears on screen as Command Center — alongside today's full date (for example, Monday, June 4, 2026), so you always know the list counts are current.
The two halves of the dashboard
On a normal-width screen the dashboard is split into two columns:
| Side | Card | What it covers |
|---|---|---|
| Left | Queue Overview | Your work — request queues, flags, activities, and today's appointment agenda. |
| Right | Status Panels | Your people — who's signed in, who's waiting to be cleared, and appointments needing confirmation. |
Each card is a set of tabs. Which tabs you see depends on your permissions and on a few site-wide settings (covered under What you see depends on your role below). Aeon remembers the last tab you had open in each card, so the dashboard reopens the way you left it — remembered per browser and device (like your theme choice), not tied to your account.
On a phone or narrow window the two columns collapse into a single full-width view with Queues and Status tabs at the top, but the contents are the same.
Left side: Queue Overview
The Queue Overview card has up to three tabs.
Queues tab
This is the default view and the heart of the dashboard. It lists every active request queue that currently has at least one request in it, each with a live request count, plus any flags in use. Empty queues are hidden so the list stays focused on where the work actually is.
- Scan the list for the queue you want — say, Awaiting Request Processing showing a count of 12.
- Click the row. Aeon opens that queue (
/requests?queue=…) with its requests ready to process.
Flags appear in the same list with a flag icon; clicking one opens the requests carrying that flag. Each row shows its count on the right and an arrow that appears as you hover, confirming the row is a link.
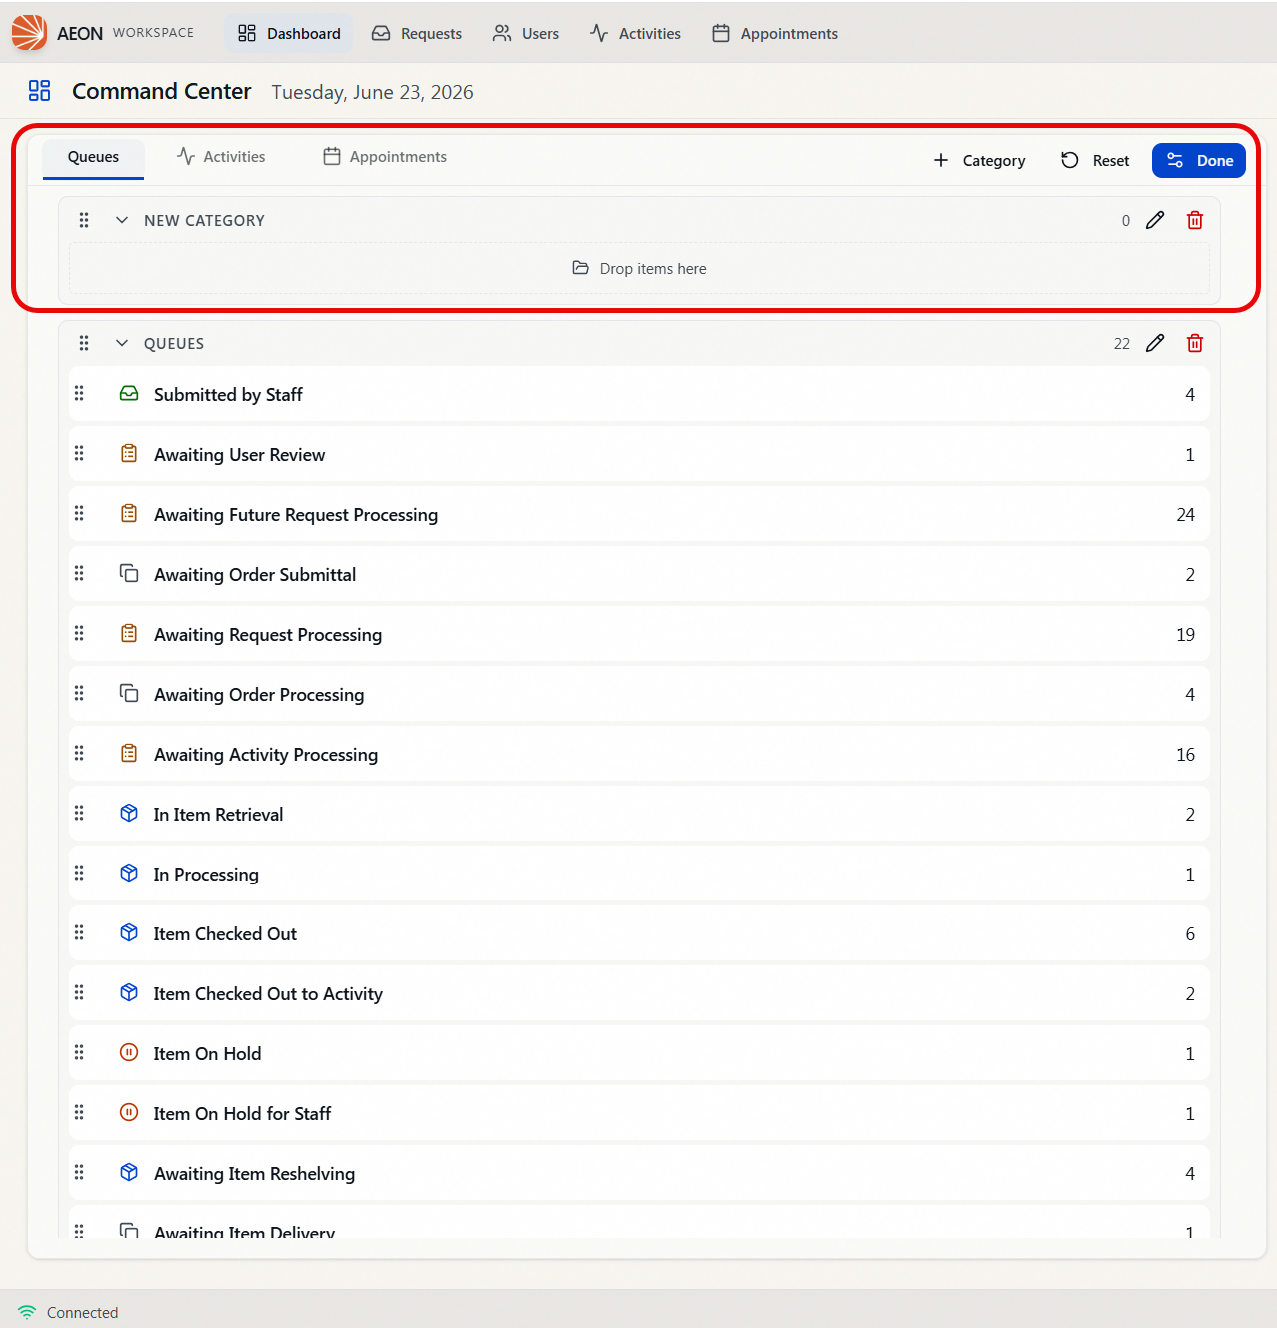
By default the queues and flags appear as one flat list. If your site has set up a Queue Designer layout, they'll be grouped into named, collapsible categories instead. You can also reshape the list yourself: click the Customize button (the sliders icon in the card's top-right corner; its tooltip reads Customize), then drag queues and flags into categories, add a new Category, rename or delete categories, or click Reset to return to the default. Click Done when you're finished — changes save automatically as you go.
Activities tab
If your role can view activities, an Activities tab appears next to Queues. It lists your active activities (instruction sessions, class visits, and the like), and clicking one opens that activity. Like the Queues tab, it supports the Customize button for grouping activities into categories by drag-and-drop.
Appointments tab (Today's agenda)
The third tab, Appointments, shows the appointment agenda for a chosen day and reading room — handy for seeing who's expected without leaving the dashboard.
- Pick a date with the date picker (it defaults to today and rolls over to the new day automatically if you leave the dashboard open overnight).
- Choose one or more reading rooms from the Reading rooms dropdown — use Select All / Clear All to toggle them in bulk. Your selection is remembered for next time.
- The agenda fills in. Click any appointment to open it in the full appointment calendar.
A small count badge on the tab tells you how many appointments match the current day and room selection.
Right side: Status Panels
The Status Panels card covers reading-room and user activity. Each tab carries a count badge so you can see what needs attention before you even click in.
Signed In tab
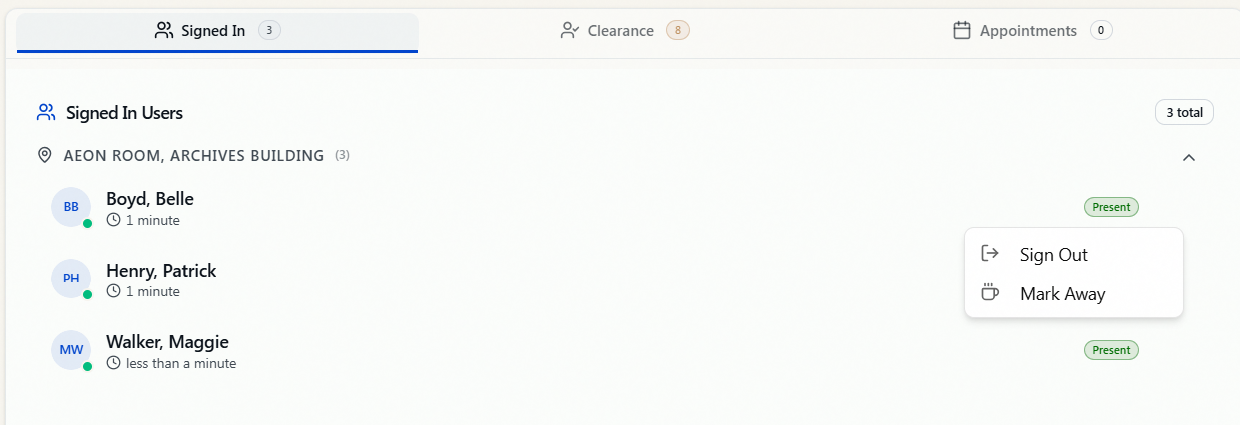
Lists the researchers currently signed in to your reading rooms, grouped by room. Each person shows their photo (or initials), how long they've been signed in, their seat or location, and a Present or Away status. The tab badge shows the total signed-in count.
You can act on a row without leaving the dashboard. Hover a person and open the ⋯ (actions) menu to:
- Set Seat / Change Seat — assign or move their location. (Shown only if you have Edit on Reading Room and the room has seats configured.)
- Sign Out — sign the researcher out. If they still have items checked out, Aeon asks you to confirm first.
- Mark Away / Clear Away — toggle their away status (for example, when they step out for lunch).
Clicking a researcher's name opens their user record.
Clearance tab
Lists users waiting to be cleared — new registrations that need staff approval before they can request. Each row shows the person's name, email, and registration date. When there are users waiting, the tab badge is highlighted (and gently pulses) to draw your eye. Click a row to open that user in the clearance workflow and approve, deny, or merge them.
Appointments tab
Lists appointments that still need to be confirmed, grouped by reading room, with an unconfirmed count per room (the count turns amber, then red, as it climbs). The tab badge shows the total across all rooms. Click a reading room to jump to that room's appointment confirmation queue.
What you see depends on your role
The dashboard is assembled from the panels your role is allowed to see, so two staff members can have legitimately different dashboards.
- Queue Overview (left card) appears if you have at least View on Requests or Activities. The Queues tab needs Requests; the Activities tab needs View on Activities; the Appointments (agenda) tab needs View on Appointments.
- Status Panels (right card) appears if you have at least View on Reading Room, Users, or Appointments. The Appointments to Confirm tab specifically needs View on Appointments.
- If your role has none of these view permissions, the dashboard shows "No dashboard panels available for your role."
Independently of permissions, an administrator can hide individual dashboard tabs for everyone through customization settings — the Signed In, Clearance, Appointments to Confirm, and Today's Appointments tabs each have a toggle. If a tab you expect is missing even though you have the permission for it, it may have been switched off for the whole site. By default all tabs are on.
Aeon can also notify you when new requests, new photoduplication requests, or new users to clear arrive — even when the dashboard tab isn't the one you're looking at — using your browser's notifications. This is opt-in: you enable it (and grant your browser's notification permission) from the notification settings, and clicking an alert takes you straight to the relevant queue or clearance list. It's a companion to the dashboard's live panels, not a replacement for them.