The Sidebar and Queue Navigation
Most of your day in Aeon starts with the same question: which pile of requests am I working on right now? Navigation in the web client is built to answer that quickly. A slim navigation bar runs across the top of every screen with one-click links to the major areas — Dashboard, Requests, Users, Activities, and Appointments — and your Dashboard lists your queues and flags as clickable entries.
There's no separate "open a queue" window to manage. Selecting a queue or flag on the Dashboard drops you into the Requests area, where a queue picker at the top of the list lets you switch between queues without leaving the page — and you can also open the Requests area straight from the top bar. However you get there, the request list updates in place and the browser URL changes to match, so the view you're looking at is always a link you can bookmark or share.
- You're starting work and want to jump to a queue, a user, or the appointment calendar — use the top navigation bar.
- You're already looking at requests and want to switch to a different queue — use the queue picker at the top of the request list.
- You're on a phone or a narrow window — open the menu (hamburger) button for the same links in a slide-out panel.
The top navigation bar

The navigation bar is always present at the top of the workspace. On the left it shows the Aeon logo, the product name AEON, and a small Workspace label; next to that are the primary area links:
| Link | Goes to | Keyboard shortcut |
|---|---|---|
| Dashboard | The dashboard home view | D |
| Requests | The request queues and request list | R |
| Users | The users list | U |
| Activities | The activities list | C |
| Appointments | The appointment calendar | A |
The link for the area you're currently in is highlighted, so you always know where you are. Requests and Users also show a small count badge when there's a number worth surfacing.
The shortcuts above are single keystrokes — just press R to jump to Requests, no modifier needed. They only fire when you're not typing in a field, so they won't interfere with search boxes or form entry. (These are different from the command palette, which opens with Cmd+K / Ctrl+K.)
On the right side of the bar you'll find:
- New — a dropdown to create a Request, Request for Activity, Requests from File, User, Activity, or Appointment. Each item appears only if you have Edit access to that record type.
- Process — a dropdown of batch-processing workflows (Check Out, Place On Hold, Reshelve Item, Item Reshelved, Item Delivered, and any custom processes your site has configured).
- Search… — opens the command palette (also
Cmd+K/Ctrl+K). - Your user menu and a more (three-dot) menu for everything else.
The navigation bar only shows the areas your role can reach. A link appears for Requests, Users, Activities, or Appointments only if you have at least View access to that area. The New options each require Edit access to the matching record type (for example, "New User" needs Edit access to Users), and the Process menu appears only with access to Batch Processing. If a link isn't there, your role doesn't have access — not a bug.
Navigating on a phone or narrow window
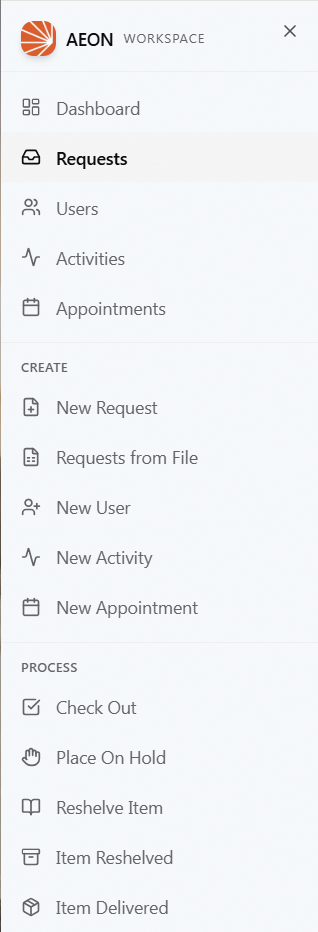
When the window is too narrow for the full bar (such as on a phone), the area links collapse into a single menu button — the hamburger icon next to the logo. Tapping it slides out a panel with the same links, grouped into sections:
- The area links (Dashboard, Requests, Users, Activities, Appointments), each respecting the same permissions and showing the same count badges.
- A Create section mirroring the New dropdown.
- A Process section mirroring the batch-processing menu.
Picking any item navigates and closes the panel. A standalone search icon stays visible in the bar so you can reach the command palette without opening the menu first.
The queue picker
Inside the Requests area, the left side of the screen shows the request list, and at the top of that list is the queue picker — the control that decides which requests you're looking at. It shows a queue view by default; when you open a flag from the Dashboard, it changes shape into a matching flag selector.
Picking a queue
By default the Requests area shows a queue view with a queue selector at the top:
- Go to Requests (top bar, or press
R). - Look at the queue selector at the top of the list. It shows the current queue — its name, an icon, and its request count. Aeon opens a default queue for you (see below), so you'll normally see a queue here rather than the empty Select a queue… prompt. Click it to switch.
- A searchable list opens. Queues sit under two built-in top-level headings — Transaction and Photoduplication — which are the queue types. Any sub-headings beneath those (the exact names differ from site to site) are the menu groups your queues are assigned in the Customization Manager, not built-in labels; queues with no menu group fall under an — Ungrouped heading. So if you see groupings like "Activity" or "Staff," those come from your site's configuration.
- Start typing in Search queues… to filter, or click a queue to open it.
The request list reloads for the queue you picked, and the URL becomes something like /requests?queue=12 so you can bookmark or share that exact queue.
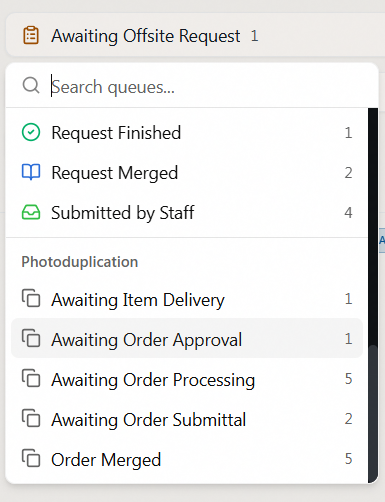
The picker lists active queues that currently have at least one request. An empty queue, or one that's been deactivated, won't clutter the list. If a queue you expect is missing, it's most likely empty right now (or inactive in the Customization Manager). The number beside each queue name is its live request count.
When you first open Requests without choosing a queue, Aeon picks a sensible starting queue for you — it prefers Awaiting Request Processing if that queue has work, otherwise the first active queue — so you land on something useful rather than a blank screen.
Browsing by flag
Flags aren't listed in the queue picker. Instead, you open a flag view from the Dashboard: its Queues tab lists your flags alongside your queues, and clicking one takes you to a view of just those flagged requests (URL: /requests?flag=8). Once you're in a flag view, the control at the top of the list becomes a flag selector that lets you switch between flags — it lists each flag that currently has flagged requests, with a count beside it. As with queues, only flags that actually have requests on them appear.
Whichever view you're in, the search box and the filter/sort controls just below the picker narrow the list inside that queue or flag — they don't switch you to a different one. Switching the picker resets those filters so you start fresh in the new view.
The dashboard as a starting point
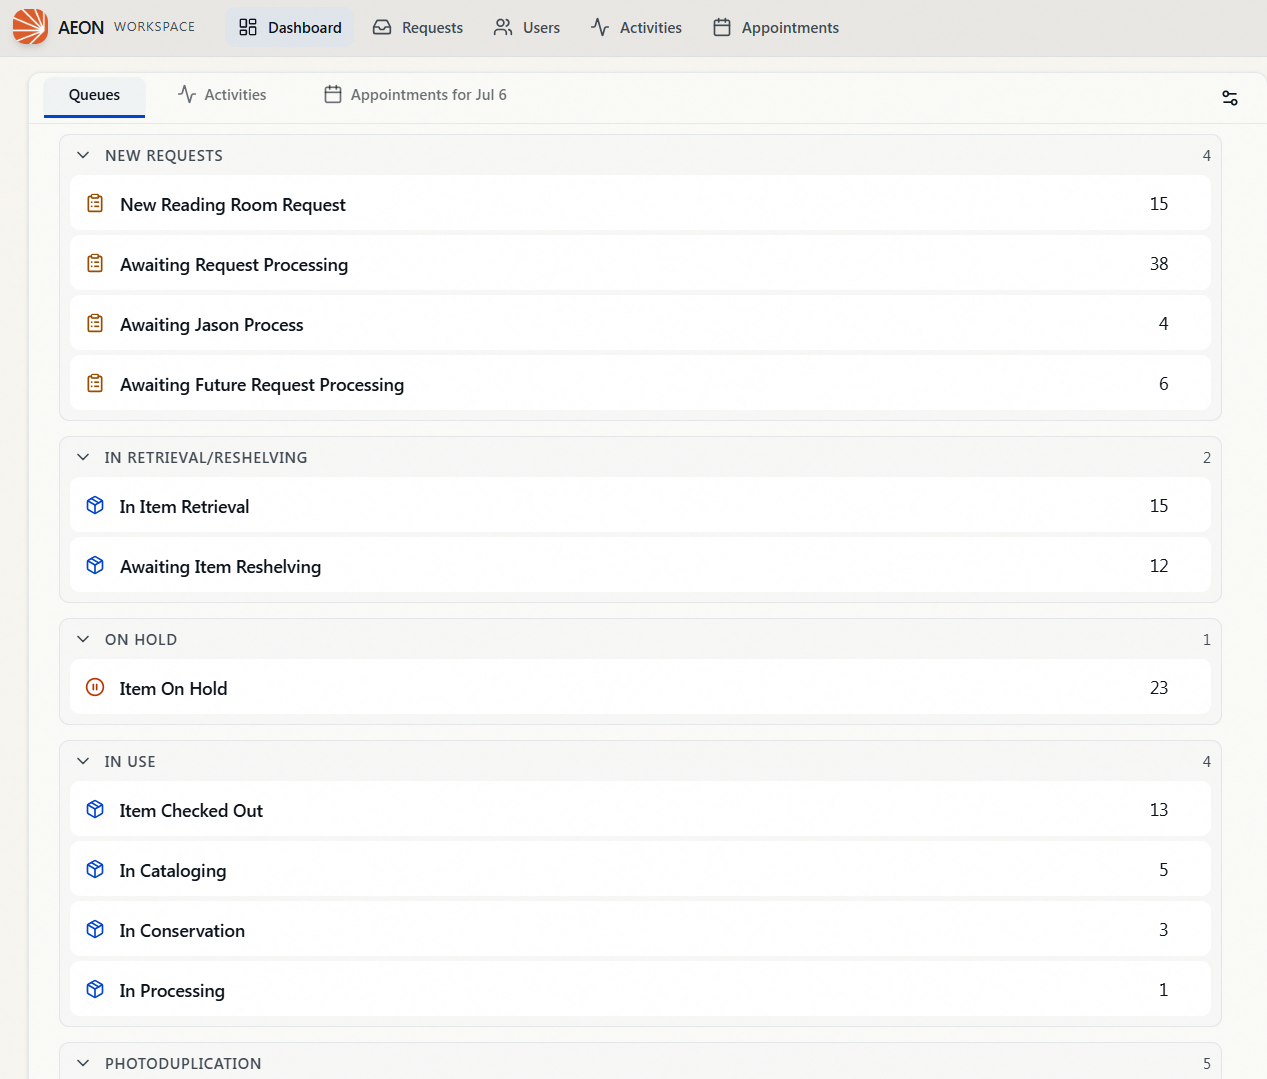
The Dashboard is the other common way into your queues. Its overview card is tabbed: the Queues tab lists your queues and flags with live counts, while Activities (and, where reading rooms are in use, Appointments) sit on their own tabs. Clicking a queue or flag drops you straight into the matching Requests view. It's the at-a-glance companion to the queue picker — use the dashboard to see where the work is piling up, then click through to deal with it.
- The whole Requests area — including the queue picker — requires View access to Requests. Without it, the Requests link is hidden and the page is not reachable.
- The queue picker itself does not gate by individual queue; it shows every active, non-empty queue your Requests access lets you load. Per-record limits (such as field restrictions) are applied when you open an individual request, not in the picker.